This data set is the Behavioral Risk Factor Surveillance System (CDC BRFSS) Smoking and Tobacco Use from 1995 to 2010. It includes the rate by which each state (and US territory) exhibits different smoking habits. The rates are weighted to population characteristics to allow for comparison of different population sizes. It includes variables such as “Smokes everyday”“Former Smoker”“Smokes some days” and “Never Smoked”. I chose it because it was complete and relatively clean, as well as spanned over a large amount of years. This allowed for more than 53 rows which I saw in multiple other data sets. I wanted to use something a bit larger than only having one entry per state.
A Note I commented out the code chunk to only display the data table.
Rows: 876 Columns: 7
── Column specification ────────────────────────────────────────────────────────
Delimiter: ","
chr (2): State, Location 1
dbl (5): Year, Smoke everyday, Smoke some days, Former smoker, Never smoked

ℹ Use `spec()` to retrieve the full column specification for this data.
ℹ Specify the column types or set `show_col_types = FALSE` to quiet this message.
We can see that there are two potential location variables, one which also includes latitude and longitude. I want to see if these locations are different, and separate the coordinates from the location. I’m also not sure what the coordinates mean – they may be the midpoint of the state, the capital, the data collection center, etc.
A quick Google search for the first set of coordinates in Oregon showed that they point to a potential state midpoint. This is confirmed by also looking at those for Indiana (my hometown!) and being placed in the heart of downtown Indianapolis in the center of the state and those for Georgia and being placed in Macon.
We can also see 4 entries which are only coordinates for 2009-2010 Guam and Virgin Islands, so we need to make sure these get moved appropriately to the correct collumns when they are not structured the same way as the rest of the data.
Cleaning the Data
#Separate location from coordinatestobacco_clean1<-separate(tobacco, col =`Location 1`, into =c("Location", "LatLong"), sep ="\n")
There are a couple warnings where there is no data for this field. I’m not super worried about those, I more just want to investigate and standardize the data that exists.
#account for data with different structurestobacco_clean1$LatLong<-ifelse(tobacco_clean1$Year %in%c(2009, 2010) & tobacco_clean1$State %in%c("Virgin Islands", "Guam"), tobacco_clean1$Location, tobacco_clean1$LatLong)tobacco_clean1$Location<-ifelse(tobacco_clean1$Year %in%c(2009, 2010) & tobacco_clean1$State %in%c("Virgin Islands", "Guam"), NA, tobacco_clean1$Location)#separate from each other coordinatestobacco_clean2<-separate(tobacco_clean1, col = LatLong, into =c("Lat", "Long"), sep =",")tobacco_clean2$Long<-str_sub(tobacco_clean2$Long, 1, str_length(tobacco_clean2$Long)-1)tobacco_clean2$Lat<-str_sub(tobacco_clean2$Lat, 2, -2)#look at similarities/differences in Location and Statedifferent_locs<-tobacco_clean2%>%filter(State != Location) different_locs #none!
# A tibble: 0 × 9
# … with 9 variables: Year <dbl>, State <chr>, Smoke everyday <dbl>,
#   Smoke some days <dbl>, Former smoker <dbl>, Never smoked <dbl>,
#   Location <chr>, Lat <chr>, Long <chr>
Great! Since there are no unusual or different inputs we can remove one of the duplicate columns
Data Table for Tobacco Use - Smoking Data for 1995-2010
This will be our dataset for analysis! It allows us to group by the “SmokeAmount” variable while having a consistent variable of interest “Rate” among all categories.
Data Analysis
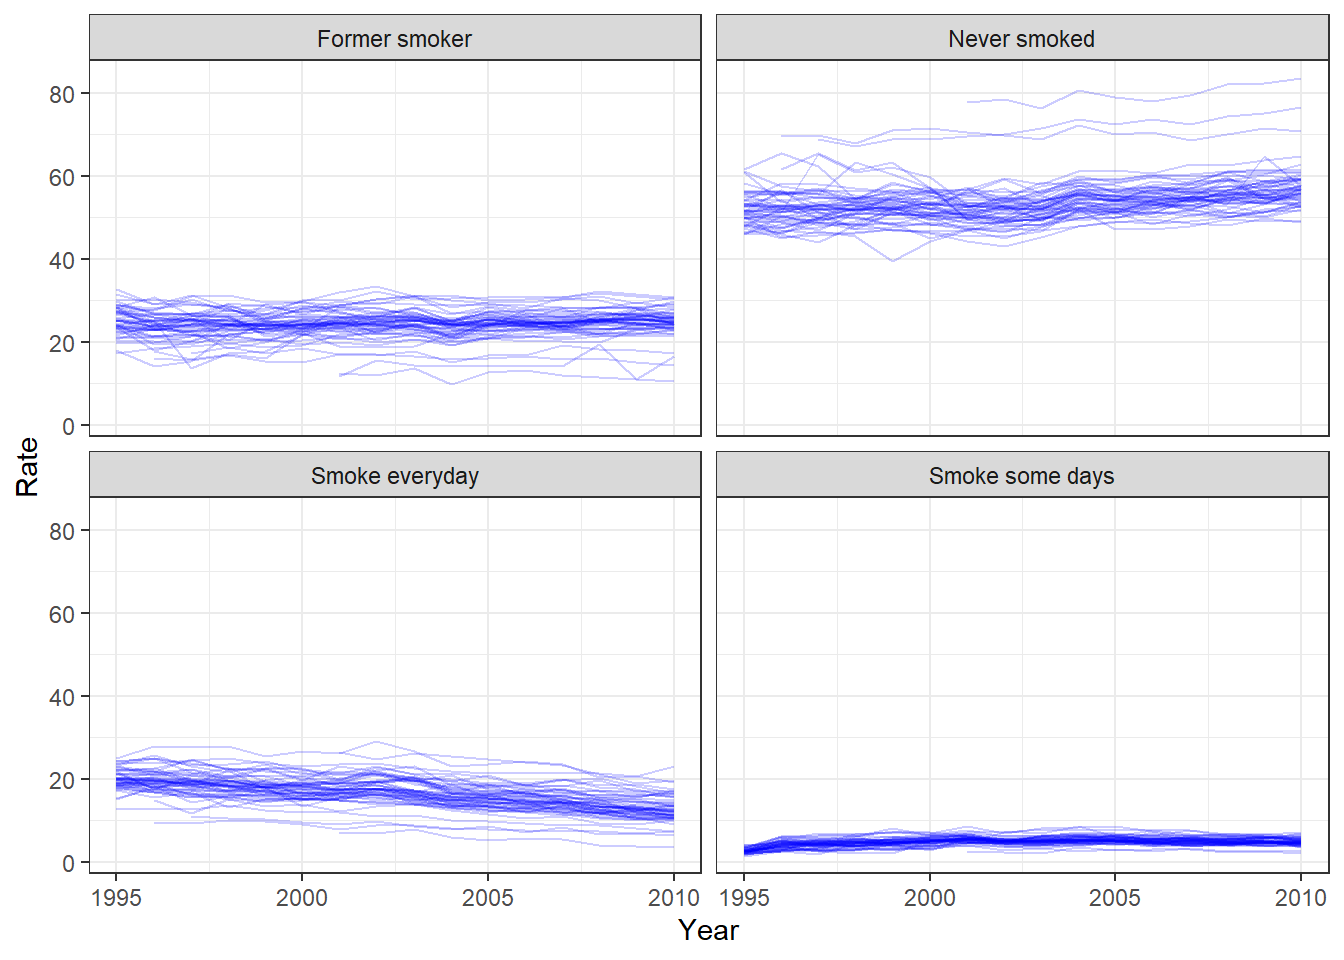
Since this data covers from 1995 to 2010, I want to first look at these variables over time. Below are plots for each category across all years.
ggplot()+geom_line(aes(x=Year, y=Rate, group=State), data=tobacco_tall, alpha =0.2, color ="blue")+facet_wrap(.~SmokeAmount)+theme_bw()
This is a bit muddy of a plot, but we can see the general trends in rates between each category. It seems like among most states it is most common to not smoke. Former smoker and Smoking Everyday seem pretty comparable with smoking everyday on the decline. Finally smoking some days is the least common, but there does seem to be a very slight increase since 1995.
This is where my work ends, best of luck to Player 2.
Kelly Hatfield’s Section
Step 1: Viewing the Tobacco R data
summary(tobacco_tall)
      Year         State                Lat             Long
 Min.   :1995   Length:3504        Min.   :13.40   Min.   :-157.86
 1st Qu.:1999   Class :character   1st Qu.:35.47   1st Qu.:-106.13
 Median :2003   Mode  :character   Median :39.49   Median : -89.54
 Mean   :2003                      Mean   :39.60   Mean   : -92.63
 3rd Qu.:2007                      3rd Qu.:43.63   3rd Qu.: -78.46
 Max.   :2010                      Max.   :64.85   Max.   : 144.78
                                   NA's   :240     NA's   :240
 SmokeAmount             Rate
 Length:3504        Min.   : 1.300
 Class :character   1st Qu.: 7.275
 Mode  :character   Median :21.000
                    Mean   :24.994
                    3rd Qu.:34.925
                    Max.   :83.700
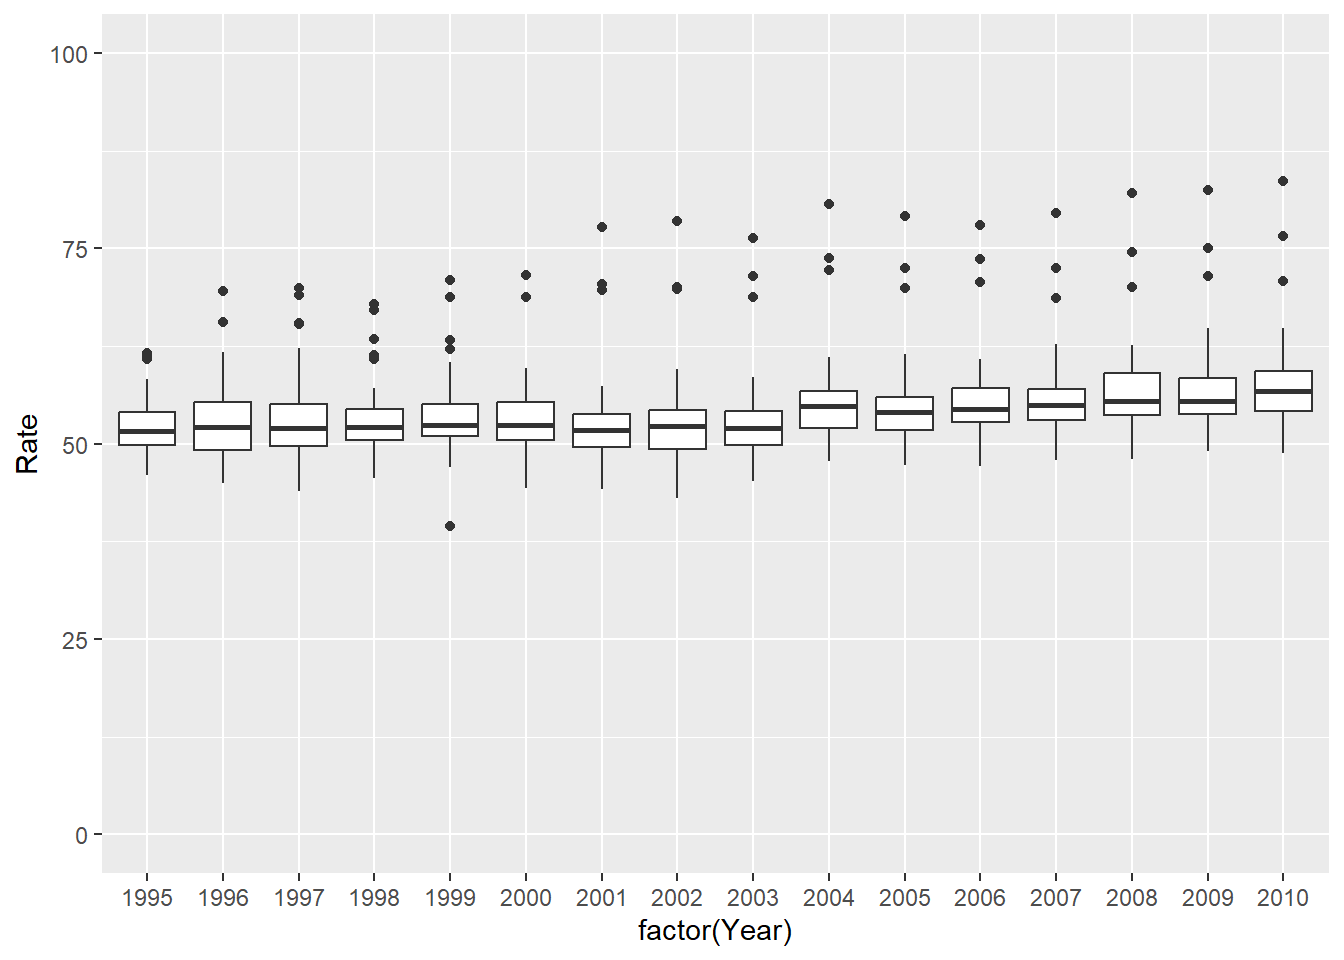
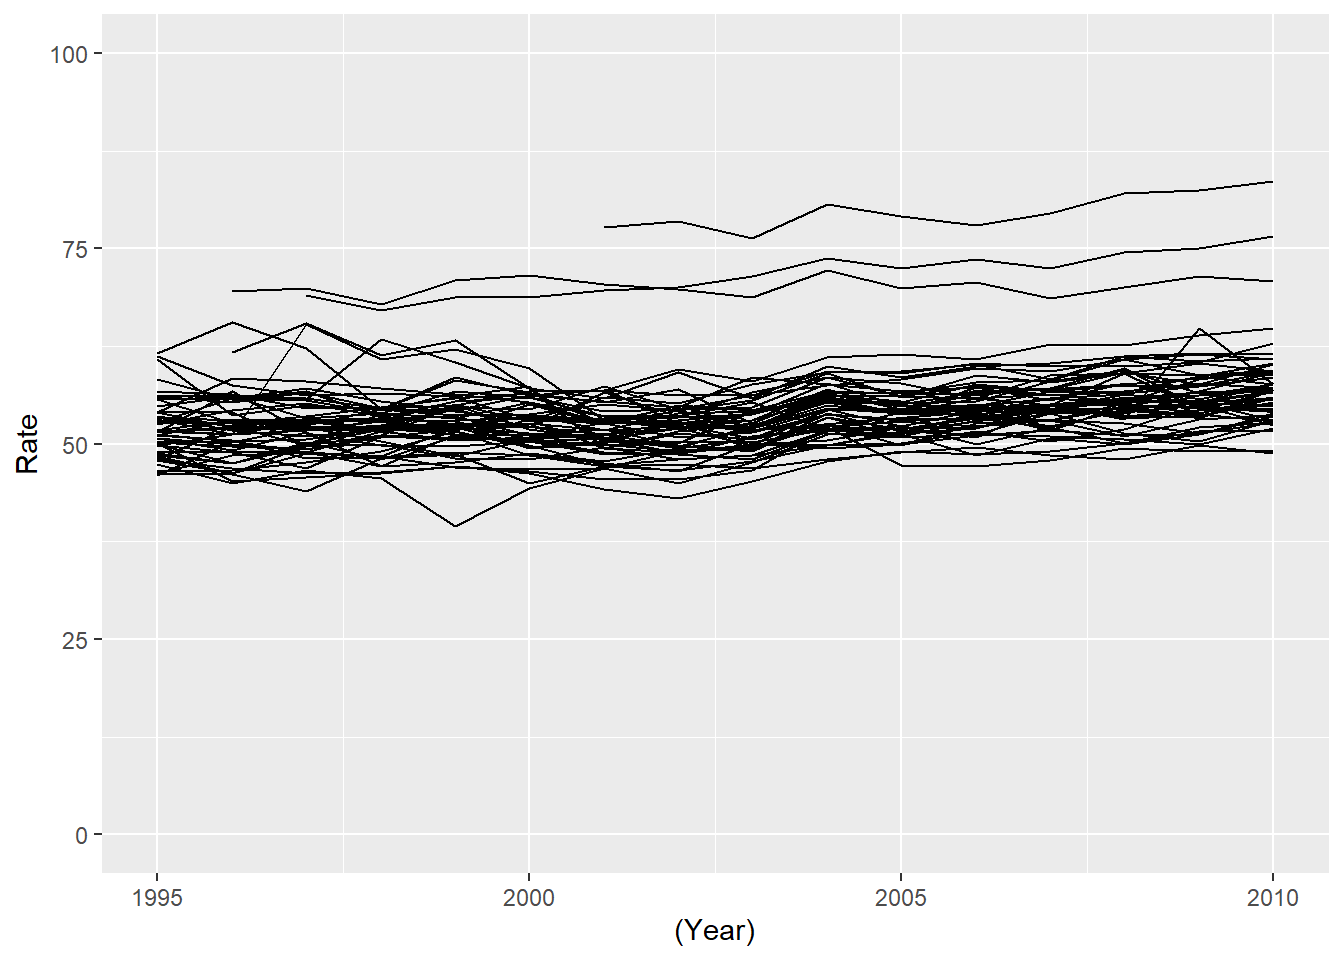
Step 2: See how many years and states are represented.
table(tobacco_tall$SmokeAmount)
  Former smoker    Never smoked  Smoke everyday Smoke some days
            876             876             876             876
tobacco_tall_NS =subset(tobacco_tall, SmokeAmount =="Never smoked")tobacco_tall_NS_2000=subset(tobacco_tall_NS, Year ==2000)table(tobacco_tall_NS$State)
                                 Alabama
                                      16
                                  Alaska
                                      16
                                 Arizona
                                      16
                                Arkansas
                                      16
                              California
                                      16
                                Colorado
                                      16
                             Connecticut
                                      16
                                Delaware
                                      16
                    District of Columbia
                                      15
                                 Florida
                                      16
                                 Georgia
                                      16
                                    Guam
                                       7
                                  Hawaii
                                      15
                                   Idaho
                                      16
                                Illinois
                                      16
                                 Indiana
                                      16
                                    Iowa
                                      16
                                  Kansas
                                      16
                                Kentucky
                                      16
                               Louisiana
                                      16
                                   Maine
                                      16
                                Maryland
                                      16
                           Massachusetts
                                      16
                                Michigan
                                      16
                               Minnesota
                                      16
                             Mississippi
                                      16
                                Missouri
                                      16
                                 Montana
                                      16
              Nationwide (States and DC)
                                      16
Nationwide (States, DC, and Territories)
                                      16
                                Nebraska
                                      16
                                  Nevada
                                      16
                           New Hampshire
                                      16
                              New Jersey
                                      16
                              New Mexico
                                      16
                                New York
                                      16
                          North Carolina
                                      16
                            North Dakota
                                      16
                                    Ohio
                                      16
                                Oklahoma
                                      16
                                  Oregon
                                      16
                            Pennsylvania
                                      16
                             Puerto Rico
                                      15
                            Rhode Island
                                      16
                          South Carolina
                                      16
                            South Dakota
                                      16
                               Tennessee
                                      16
                                   Texas
                                      16
                                    Utah
                                      14
                                 Vermont
                                      16
                          Virgin Islands
                                      10
                                Virginia
                                      16
                              Washington
                                      16
                           West Virginia
                                      16
                               Wisconsin
                                      16
                                 Wyoming
                                      16